Interactive Maps
Quick Links
MKE Indicators
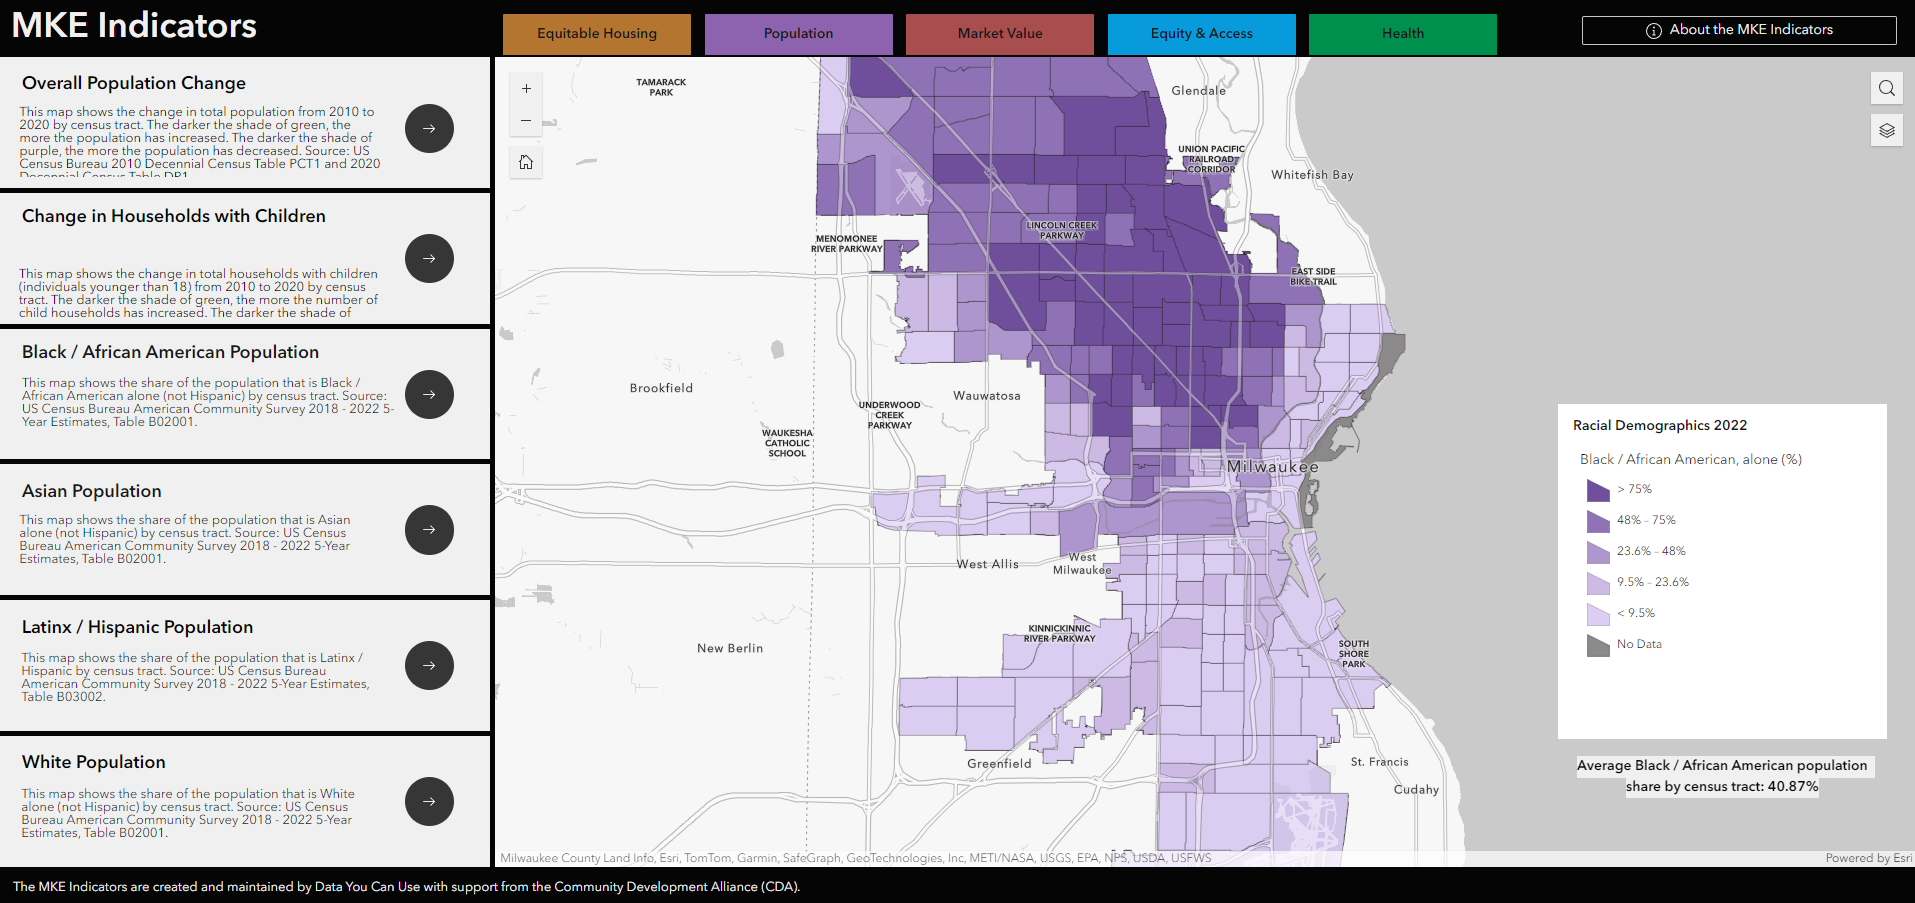
With support from the Community Development Alliance, we created the MKE Indicators with the aim to help community members, planners, policy makers, and neighborhood organizations to plan, document, and explore key piece of information about their neighborhoods. The MKE Indicators compliment our neighborhood portraits by providing additional variables and a city-wide view of important topics.
Milwaukee Homebuyer Counseling Data
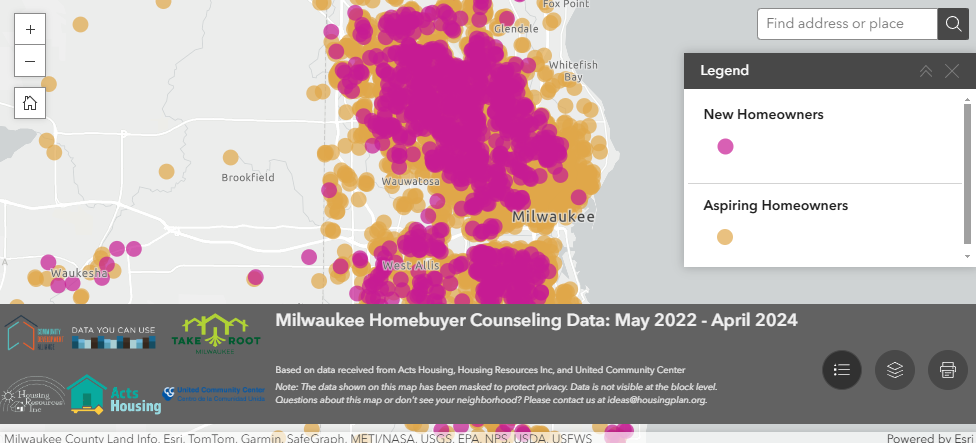
Data You Can Use serves as a data partner to the Community Development Alliance (CDA). Through that partnership, we have worked with the CDA’s partner homebuyer counseling agencies to track progress in advancing homeownership in Milwaukee. This map serves to show all individuals who have entered homebuyer counseling through the partner agencies and the subset of those individuals who have purchased a home. The locations of these individuals are masked to protect their identities, with the locations being randomized within a certain radius of the true location, and the dots not being visible as a user zooms in to a certain level on the map. With this map, one can toggle boundaries, including State Assembly Districts, State Senate Districts, County Supervisory Districts, City Aldermanic Districts, and various neighborhood boundaries. For each boundary, a user can click on a district/neighborhood and see the counts of aspiring and new homeowners within the boundary.
Milwaukee Property Reference Map
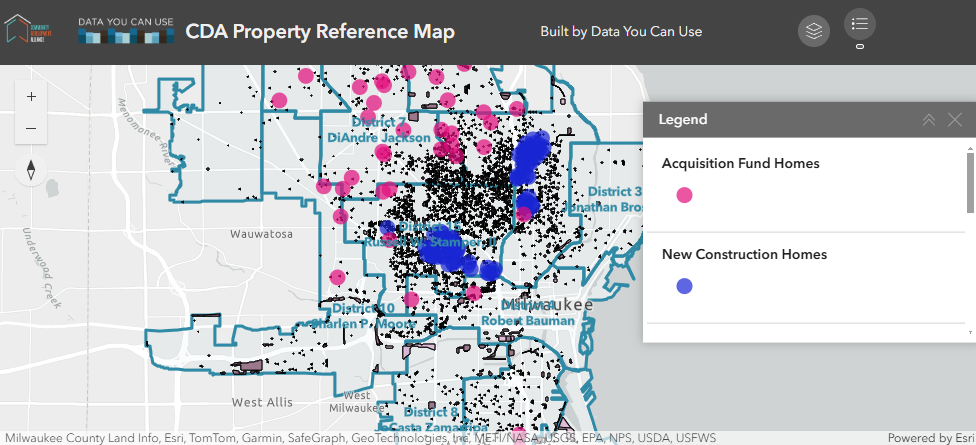
Data You Can Use serves as a data partner to the Community Development Alliance (CDA). Through that partnership, we developed a property reference map to aid service providers, advocates, policymakers, and residents to understand the landscapes of their neighborhoods. This map shows the vacant lots, property sales, acquisition fund, and new construction homes built in the City of Milwaukee. Selectable boundaries include City Aldermanic Districts and various neighborhood boundaries, and selectable layers include 2020-2023 property sales, total vacant lots, City-owned vacant lots, privately-owned vacant lots, and zoning codes. Also displayed are the homes purchased through the acquisition fund and are new construction homes. The locations of these homes are masked to protect identity, with the locations being randomized within a certain radius of the true location, and the dots not being visible as a user zooms in to a certain level on the map. The user can click on each parcel to see the associated MPROP information or property sale information, and can click on each boundary to see the summary of property sales, vacant lots, acquisition fund homes, and new construction homes.
MKE HMDA Data Explorer
Home Mortgage Disclosure Act (HMDA) data allows curious data explorers to understand how many people applied for mortgages, and the actions taken on those mortgage applications (i.e. if they were approved, denied, or never completed). In the MKE HMDA Data Explorer, HMDA data is shown by census tract for the City of Milwaukee to better understand the distribution of mortgage investment across Milwaukee Neighborhoods.
All of the data show is for mortgages used to purchase homes by owner-occupants in 2022. HMDA data is released each spring for the previous year.

This interactive map is brought to you by a collaboration between the Metropolitan Milwaukee Fair Housing Council and Data You Can Use.
For questions about the tool and/or the data, please contact:
The DYCU team // [email protected] or
Russell Star-Lack // [email protected]
Milwaukee Food Environment Map
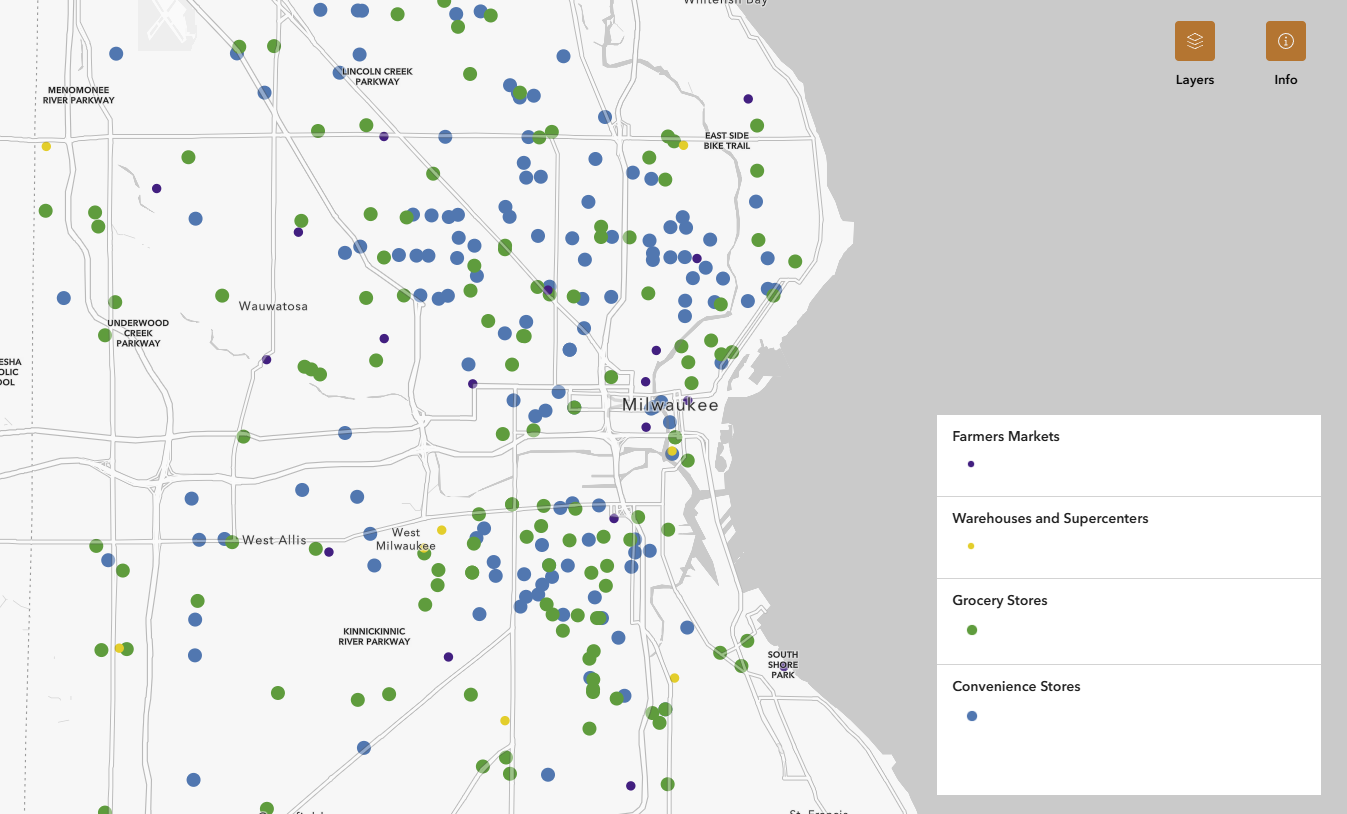
At Data Day 2023, the Milwaukee Food Council was awarded a Data Dream. Through the collaboration between Data You Can Use and the Milwaukee Food Council, the Milwaukee Food Environment Map was created to aid service providers and community members in identifying where food can be accessed in Milwaukee County.
This tool has two geographic maps and one network map. The first map displays the Emergency Food environment of Milwaukee County, including the food banks, pantries, and meal sites where individuals can seek food assistance. The second map displays the Food Access environment of Milwaukee County, including most establishments where food can be purchases, such as grocery stores, farmers markets, convenience stores, and warehouses / supercenters. The Food Network Kumu Map shows the relationship and connections between the various food actors of Milwaukee County.
This interactive map is brought to you by a collaboration between the Milwaukee Food Council and Data You Can Use.
For questions about the tool and/or the data, please contact:
The DYCU team // [email protected] or
Jessica Thompson // [email protected]

Bank On Greater Milwaukee Financial Inclusion Map
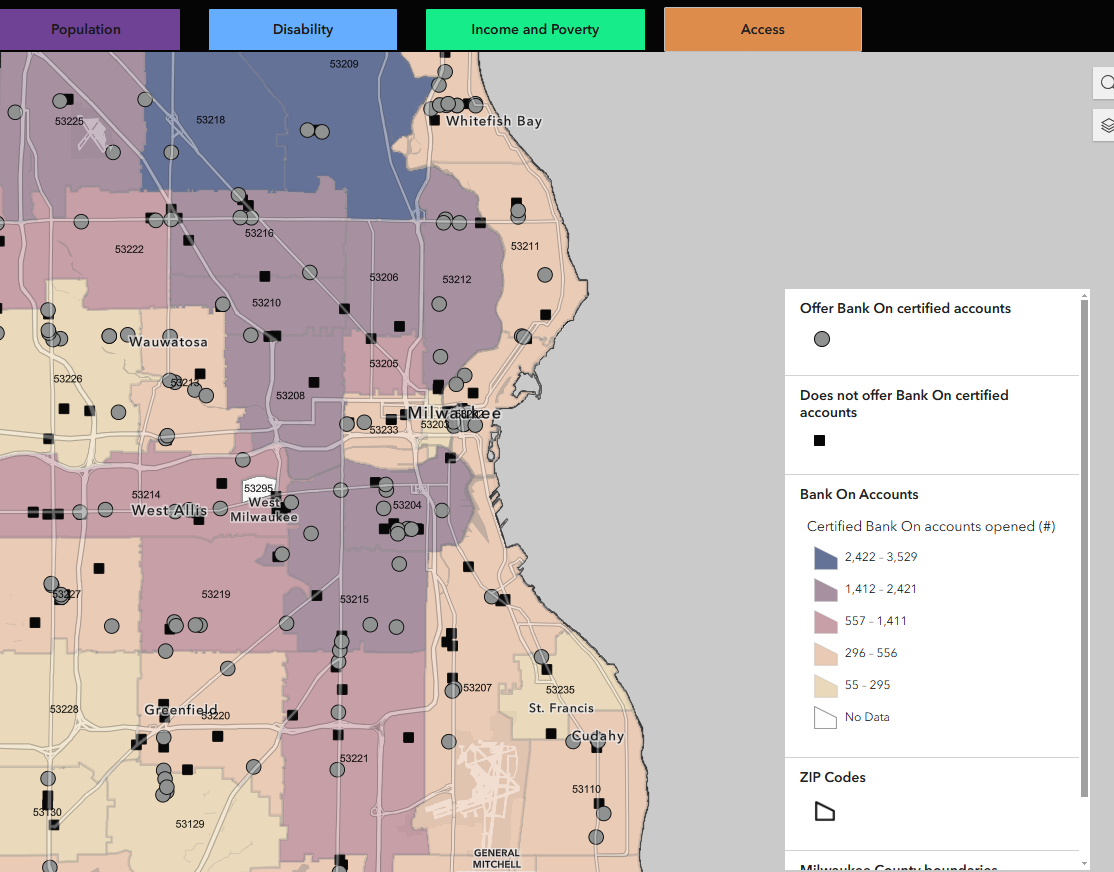
This mapping portal is a tool for Milwaukee residents, service providers, financial institutions and others who believe that access to bank accounts is paramount for financial health and stability. Bank On Greater Milwaukee is committed to financial inclusion, partnering with local financial institutions to offer no or low-fee checking and savings accounts to customers who may face barriers to traditional banking. These maps show where financial institutions are located and which of these have with Bank On certified accounts.
Learn more about Bank On Greater Milwaukee here.
Learn more about Bank On National Account Standards here.
These interactive maps were created by Data You Can Use in partnership with Bank On Greater Milwaukee and the Urban Economic Development Association, with funding support from a City of Milwaukee grant of Community Development Block Grant funds.
For questions about the tool and/or the data, please contact:
The DYCU team // [email protected] or
Constance Alberts // [email protected]

Milwaukee COVID-19 Health Conditions
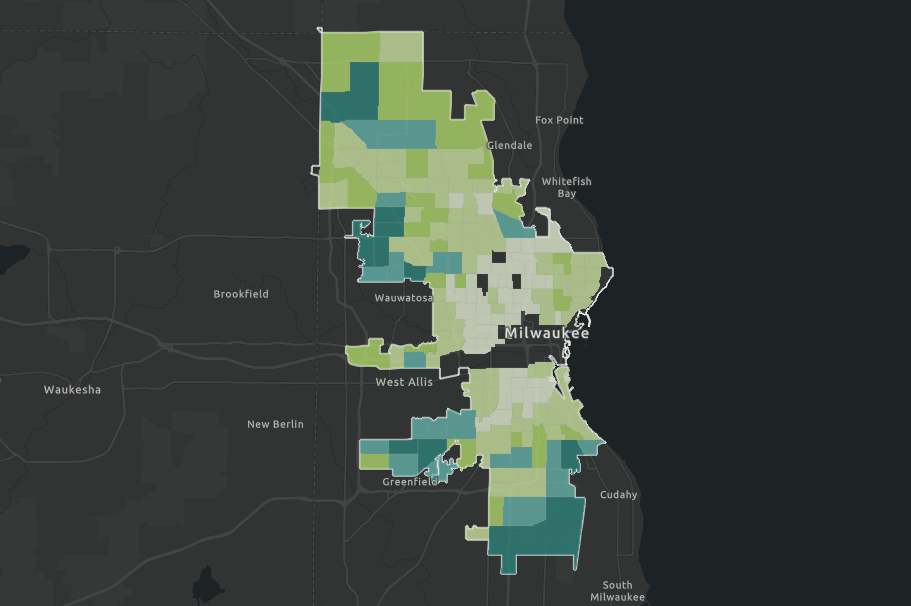
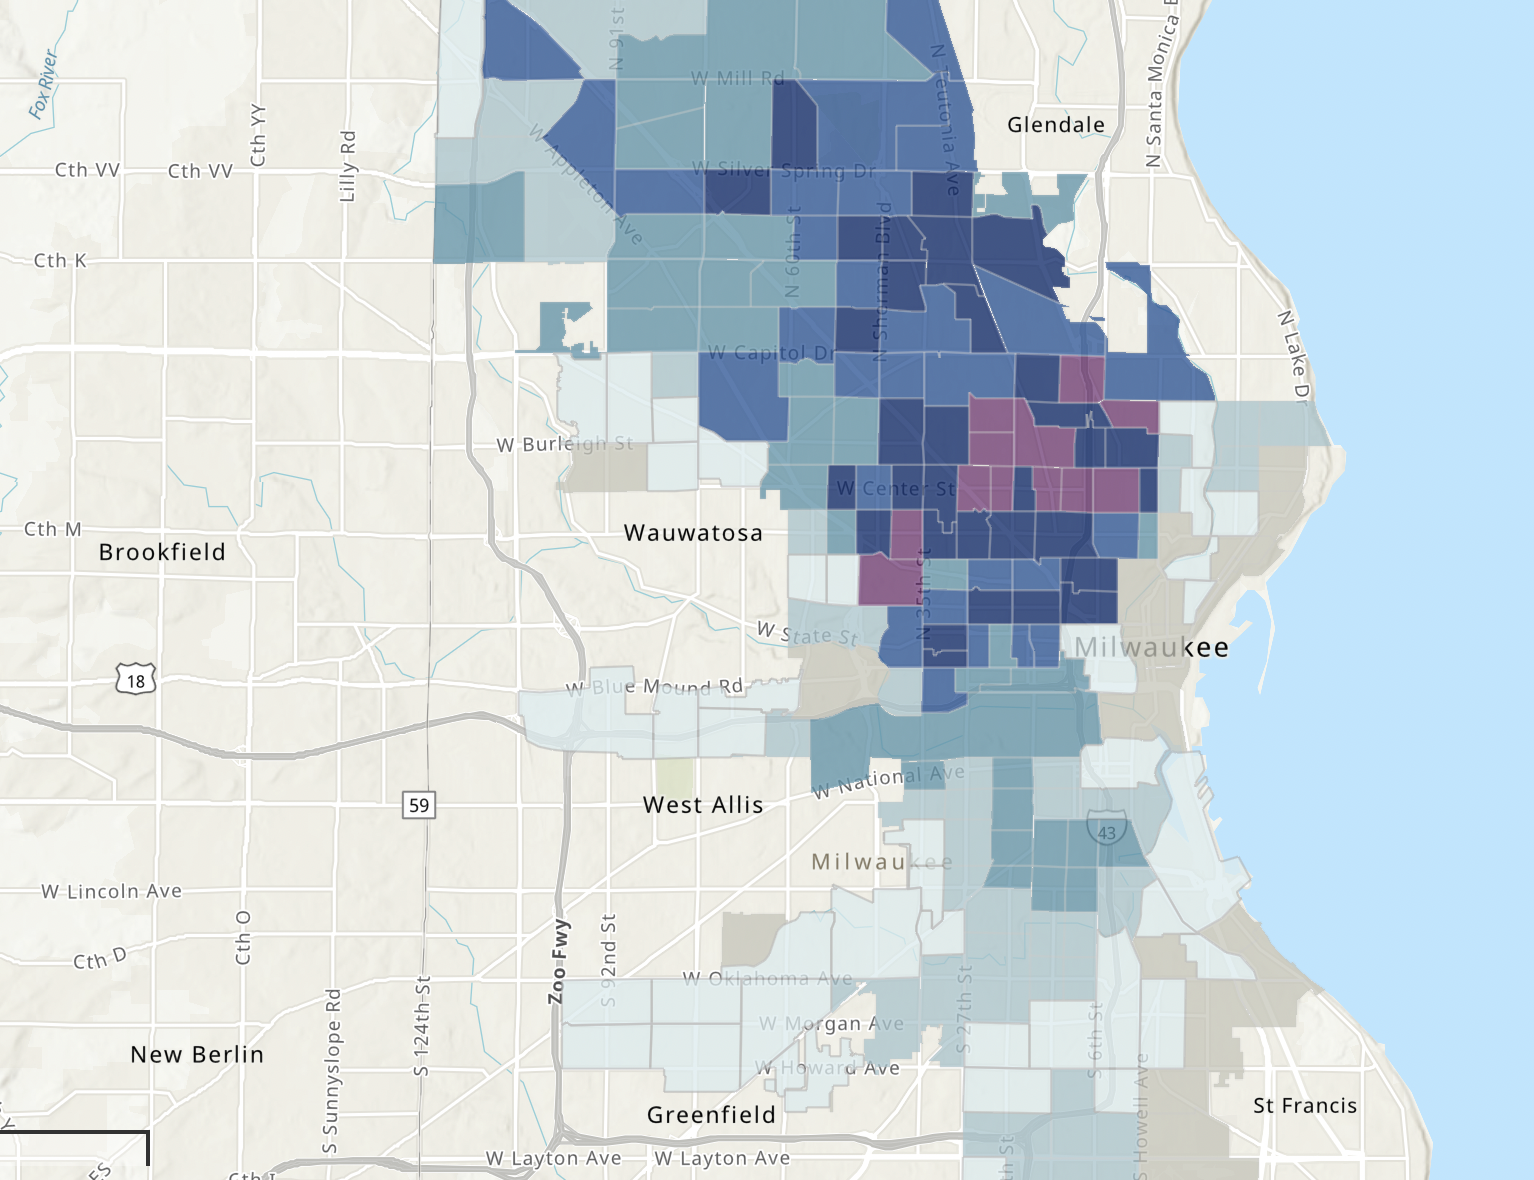
Created in 2020, this interactive map shows health conditions that may signal greater caution for COVID-19, mapped by census tract across the City of Milwaukee using data from the CDC’s 500 Cities Project. The map also outlines approximate neighborhood geography using Census tracts. Data You Can Use also created COVID-19 Health Digests for 16 neighborhoods across the city to help residents and elected officials better understand the risks to Milwaukee citizens with pre-existing conditions.
Health Conditions Neighborhood Data Digests
The Bridge Project Participant Map
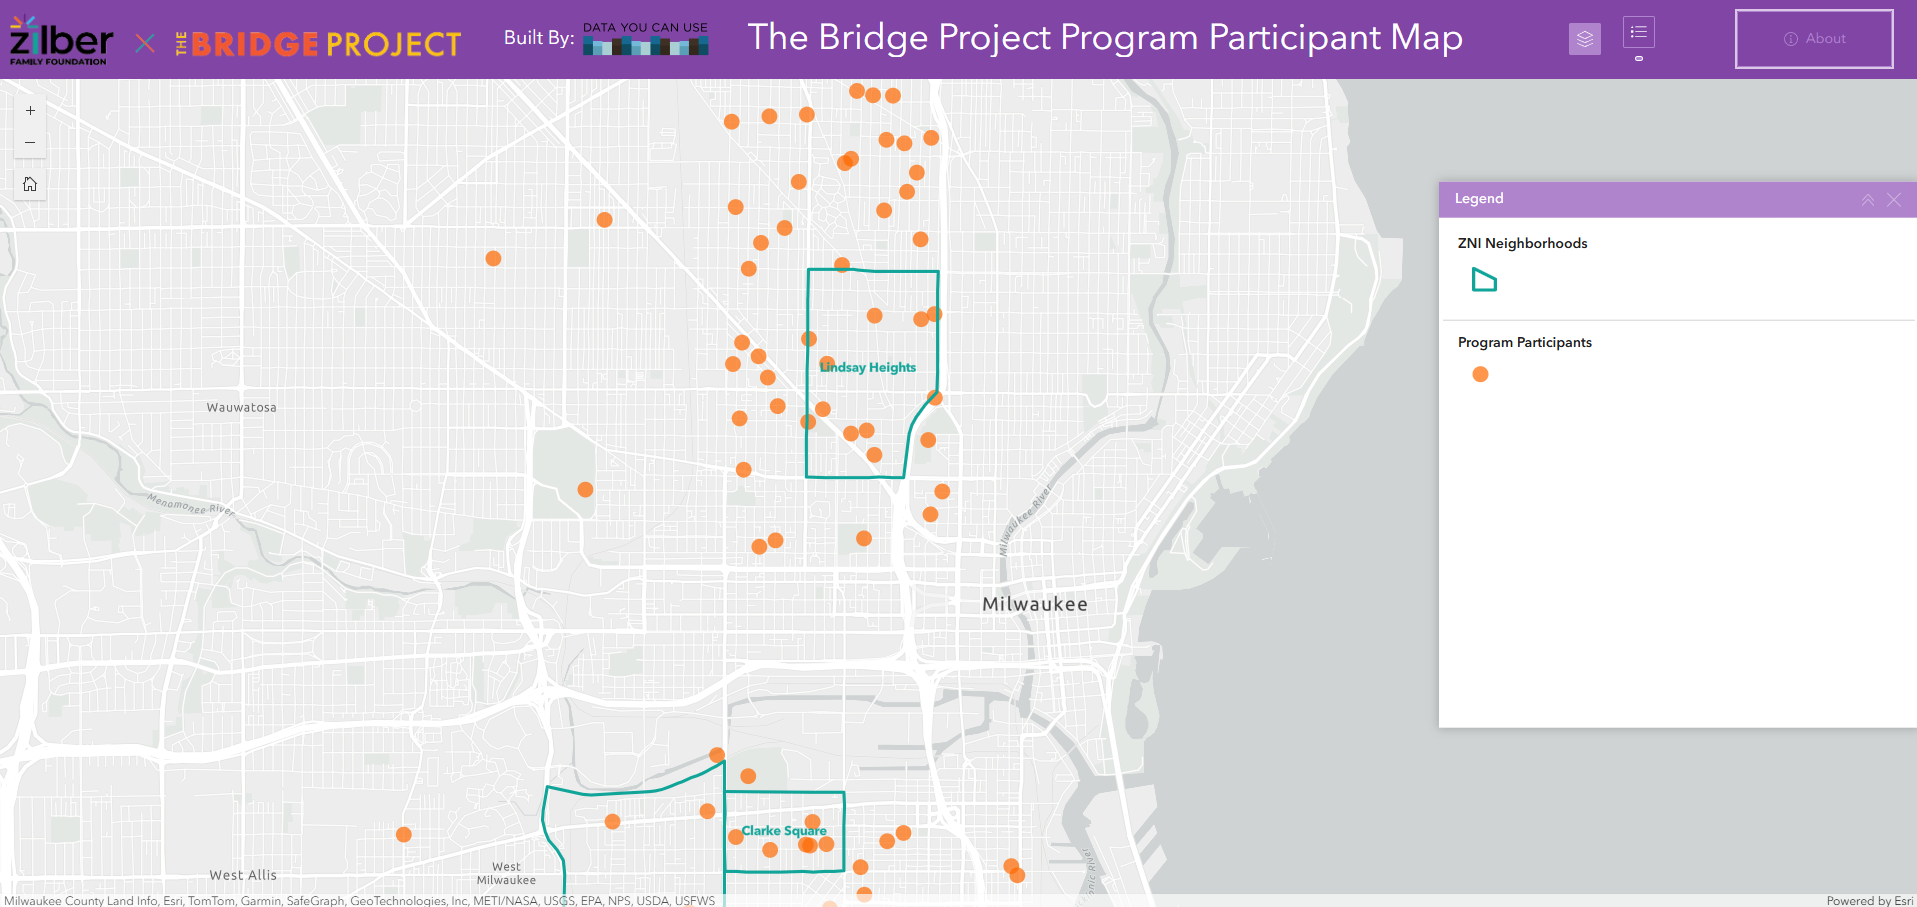
Data You Can Use serves as a data partner to the Zilber Family Foundation. In an innovative collaboration, the Zilber Family Foundation joined forces with The Bridge Project to introduce Milwaukee first unconditional cash program. This transformative program was dedicated to empowering the community through financial assistance, focusing on providing unconditional cash transfers to pregnant individuals in the city. Data You Can Use created this participant map to track the project’s progress.

