MKE Indicators
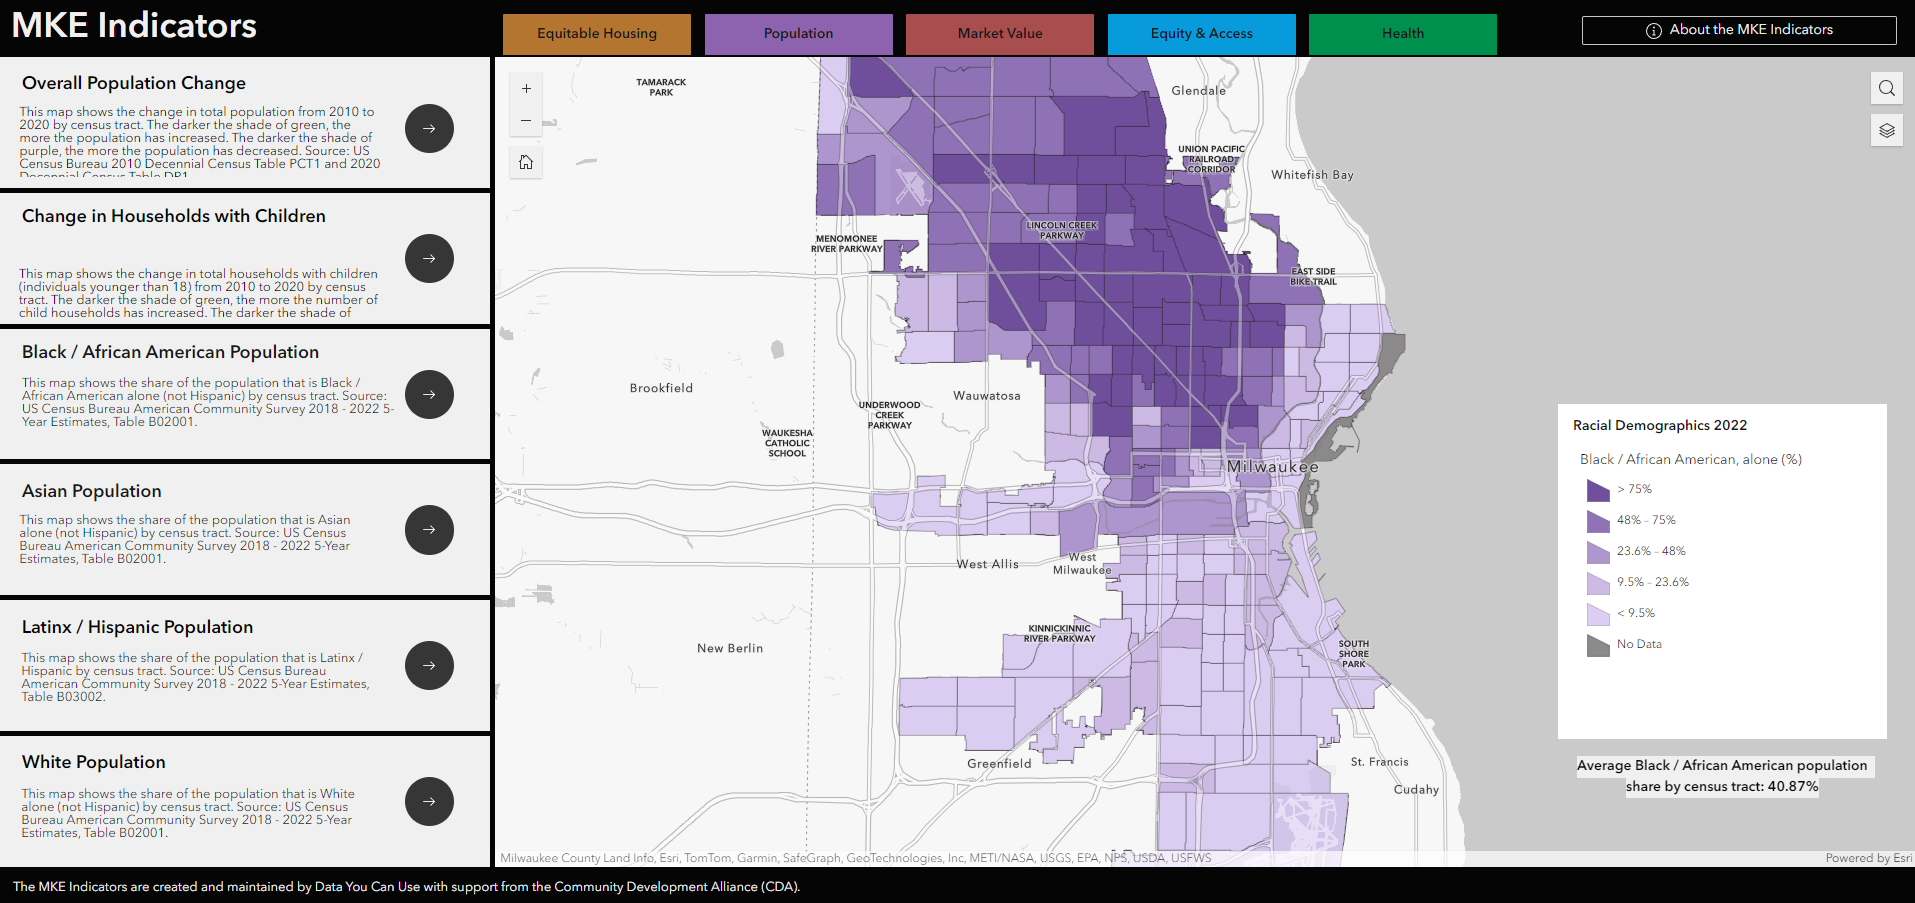
Data You Can Use, in collaboration with the Community Development Alliance, is pleased to release this 2025 update of the indicator maps for Milwaukee’s neighborhoods. These indicators are intended to help community members, planners, policy makers, and neighborhood organizations to plan, document and explore key pieces of information about their neighborhoods.The MKE indicators compliment our Neighborhood Portraits by providing additional variables and a city-wide view of important topics.
Explore data across five categories: Equitable Housing, Equity & Access, Population, Health, and Market Value!
In this new release, we have updated 19 indicators with the most recent data from the American Community Survey 5-Year Estimates 2019 – 2023 and the CDC PLACES 2022 datasets. In addition to updated data, in this launch, we have added a feature that allows the user to not only view neighborhood boundaries on the maps, but to see the indicator data aggregated at the neighborhood level. To find data at the neighborhood level, turn on a neighborhood boundary using the “Layers” button in the top right corner of the screen, then click on the neighborhood boundary to access the data pop-up. Data for these indicators were drawn from a variety of sources, including the US Census Bureau’s American Community Survey, the CDC’s PLACES Health data, the City of Milwaukee, and others. Due to this, the data represented are not all from the same year. Furthermore, while most indicators are displayed at the census tract level, some are displayed at different geographies, such as block groups. You can learn more about the data and access downloadable datasets here.

